Quickstart
Getting started with Entwine is easy with Conda. Let’s use Entwine to fetch and organize some public data, visualize it in our browser, and extract a quick elevation model and hillshade from it.
Installation
First, install Miniconda (or full Anaconda if you prefer) by downloading and running the install script for your platform. Then, run a shell and create an Entwine environment:
conda create -n entwine -c conda-forge entwine
This will create a new Conda environment, add the Conda Forge catalog to it, and install the Entwine package from the Conda Forge catalog.
Activate the entwine environment to use it:
conda activate entwine
Building the data
Make an Entwine data directory at entwine and use Entwine to fetch
the Red Rocks Amphitheatre dataset from the internet and build an
EPT dataset of it:
entwine build -i https://data.entwine.io/red-rocks.laz -o ~/entwine/red-rocks
Now we have our output at ~/entwine/red-rocks. We could have also
passed a directory like -i ~/nyc/ to index multiple files.
Now we can statically serve the entwine directory with an HTTP server
and visualize it with the WebGL-based Potree and Plasio projects.
Viewing the data
Conda makes it easy to grab other things, and so we’ll grab
NodeJS and install http-server from it:
conda install nodejs -y
npm install http-server -g
http-server entwine -p 8080 --cors
Note
We need to set the --cors option to allow our localhost
HTTP server to serve data to the remote Potree/Plasio
pages.
With the server running, we can visit special Potree or Plasio URLs that allow you to take in localhost URLs and visualize them:
Processing with PDAL
We can also use the PDAL EPT reader to create an elevation model of the data. This can be done over HTTP or the local filesystem. Use PDAL to translate the service to a GeoTIFF using the GDAL writer driver:
pdal translate ept://entwine/red-rocks red-rocks-dtm.tif --writers.gdal.resolution=2.0
That doesn’t give us much to see, so let’s create a hillshade using gdaldem:
gdaldem hillshade red-rocks-dtm.tif hillshade.png
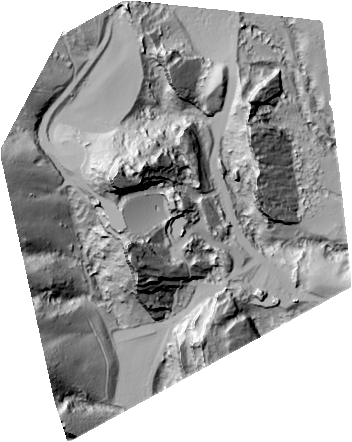
Red Rocks Amphitheater (data from DroneMapper).
See also
For further information about how to configure Entwine - like reprojecting data, using configuration files and templates, enabling S3 capabilities, and producing Cesium 3D Tiles output - see the Configuration section.